2-6 Purely Inductive Circuits
- In a DC circuit, the inductance voltage across an inductor is zero. This can be seen mathematically by referring to the formula
that defines the voltage across an inductor,
 .
As
.
As  becomes smaller and smaller (this of course
being the change in time) the larger and larger that
 becomes. As there is a constant current in a DC circuit
with no consideration for the passage of time,
  will
end up being zero.

This is a purely inductive AC circuit. It will be supposed to have no resistance and no capacitance. The current for this circuit is
 where
where
 equals the effective current magnitude.
We remember, of course, from section 2-3 the equation
 .
This tells us that the instantaneous voltage drop across a resistance is equal to the resistance times the magnitude of that current at time
 . And that works perfectly for a circuit in which there is only
resistance. But the circuit we are currently exploring has inductance. Just what does this inductance do?
In the last section we discovered that an inductor will store energy in a field around it if it is in a circuit with a varying current. It will develop a voltage drop in the direction of the current flow. However, due to the nature of the inductor and the storing of the energy in the field surrounding it, it does not act like a resistor. Indeed, the application of voltage to the inductor leads the resulting current by an angle of
 .
Since this is occurring throughout the entire cycle, there is never a point that the maximum voltage and current are present at the inductor simultaneously.
That is why we will need to alter the equation we saw in section 2-3 to accommodate this difference.
Think for a moment about what happens when you throw the switch on an inductive circuit. Immediately the voltage at time zero is at its peak. The field is built around the inductor. As the voltage begins to drop, current begins to flow in the circuit. By the time
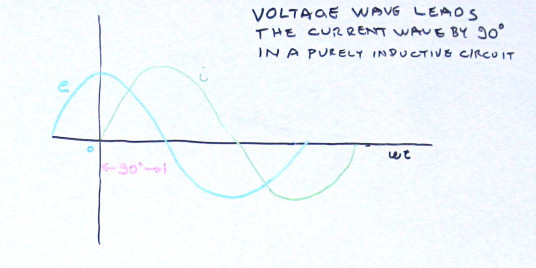
 of the cycle has passed, the voltage has dropped to zero and the current has reached its peak. Let's look at an illustration of this.
 The line marked "e" here is the voltage wave and the line marked "i" is the current wave. The two waves are out of phase as was described above. The voltage
wave is at its peak at time zero. Trigonometrically speaking, this is a cosine wave. The current is zero at time zero and is therefore a sine wave.
This is why the resistance only equation will not do here to calculate the instantaneous voltage.
The phase shift is one quarter cycle or
 . To
get the correct voltage, we need to shift the point where we are to obtain the current by
  .
This becomes the equation we use for the instantaneous voltage drop across an inductor in a purely inductive circuit.

In this equation, the square root of two is just a coefficient. The variables
 cos
cos 
 account for the current. And indeed they do just that. The cosine
function time shifts the current (amperes) sample point back one quarter cycle. This leaves the variables

 amount to the "resistance" due to the inductance. This "resistance" is referred to as "Inductive Reactance" .
Inductive Reactance in ohms is

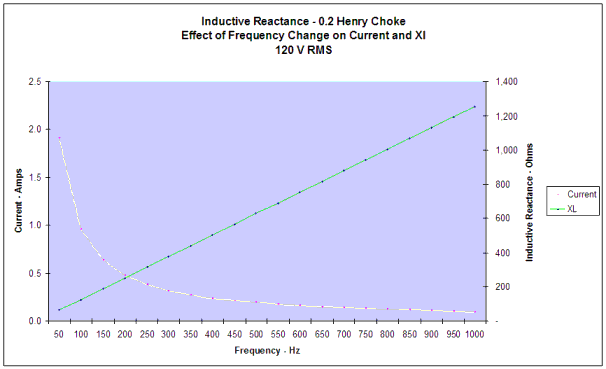
To get a better idea of how current and inductive reactance are related to the frequency in an AC circuit, look at this illustration.
 Notice that as the frequency rises, the inductive reactance rises; at the same time the current falls. This helps to show why a large inductor is called a
"choke" as it was here in this graph. The lower frequencies are passed with little problem. However, as the frequency rises, the current is "choked" off
by the increased inductive reactance. What we end up with is a "resistance" that is different for different frequencies, a most useful characteristic.
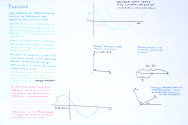
From this point we need to understand how to represent graphically the phase differential between voltage and current. This is done with "phasor diagrams". The white board illustration here will cover this topic in some depth as it relates to inductive circuits.
