Chapter 2-2: Sinusoidal Voltages and Currents
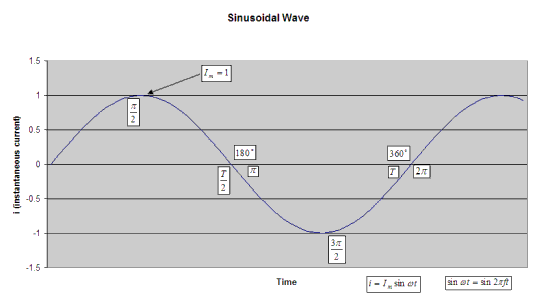
- A Sinusoidal Current has an equation that shows the current as a function of time. It looks like this:
 where
where  is the instantaneous current at any time is the instantaneous current at any time
 and
and  is the maximum value or amplitude.
The quantity
  is expressed in radians per second and is
the angular velocity. is expressed in radians per second and is
the angular velocity.

- When the instantaneous current passes through one complete set of positive and negative values, it is said to
have completed one cycle. The graph above illustrates one cycle as the instantaneous current
goes from the 0 degrees point to the 360 degrees point (or from 0 radians to
 radians). radians).
- The number of cycles that are passed through each second is known as the frequency of the wave. This
frequency is expressed in cycles per second or Hertz.
- The time for once cycle may be calculated by:
 with
with  = Time,
and = Time,
and  = frequency. = frequency.
 may be plotted as a function of time
or may be plotted as a function of the angle may be plotted as a function of time
or may be plotted as a function of the angle
 in electrical radians.
One complete cycle spans in electrical radians.
One complete cycle spans  radians or
360 electrical degrees. radians or
360 electrical degrees.- It follows then, that
 . .
- And, by using these equations together, we can also represent the instantaneous current this way:
 . .
- In many circuits the current and voltage waves do not go through zero simultaneously, but are displaced from each other
by a phase angle. We have equations to represent that current and voltage are not necessarily in phase with one
another and do not necessarily cross the x-axis at 0 degrees. These equations look like this:
 and and
 . .
 and and
 are simply padding parameters that indicate how far before the
y-axis that the voltage and current curves respectively, cross the x-axis. are simply padding parameters that indicate how far before the
y-axis that the voltage and current curves respectively, cross the x-axis.

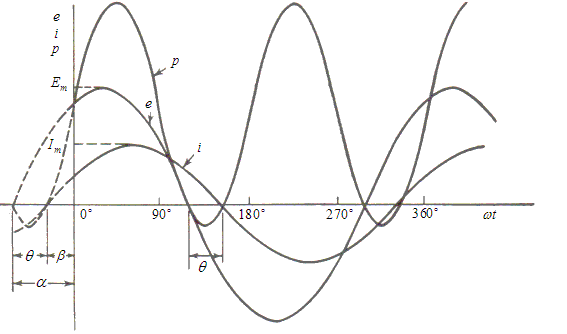
- The graph above shows three curves, all of them representing instantaneous values. The curves are, respectively,
current, voltage and power.
 is the phase angle between the
voltage and the current. It measures the distance between the points where each curve crosses the x-axis. In this graph, the voltage leads the current.
Or we can say that since the current peaks later than the voltage, that the current lags the voltage. is the phase angle between the
voltage and the current. It measures the distance between the points where each curve crosses the x-axis. In this graph, the voltage leads the current.
Or we can say that since the current peaks later than the voltage, that the current lags the voltage.
- The instantaneous power curve
 is derived from the product of the instantaneous values
of is derived from the product of the instantaneous values
of  and and  .
Now, note this interesting point; even though both current and voltage are oscillating between large positive and negative values, the power is almost entirely positive! Why?
The only time the power will be negative is when the sign of the voltage and current do not match. This only occurs in our example during the time covered by the
phase angle .
Now, note this interesting point; even though both current and voltage are oscillating between large positive and negative values, the power is almost entirely positive! Why?
The only time the power will be negative is when the sign of the voltage and current do not match. This only occurs in our example during the time covered by the
phase angle  where voltage has turned negative and before
the current has crossed the x-axis to become negative. Were voltage and current exactly in phase, the power would
be 100% positive! where voltage has turned negative and before
the current has crossed the x-axis to become negative. Were voltage and current exactly in phase, the power would
be 100% positive!
|
|
 where
where  is the instantaneous current at any time
 and
and  is the maximum value or amplitude.
The quantity
  is expressed in radians per second and is
the angular velocity.
 radians).
 with
with  = Time,
and
  = frequency.
  may be plotted as a function of time
or may be plotted as a function of the angle
 in electrical radians.
One complete cycle spans
  radians or
360 electrical degrees.
 .
. .
. and
and
 .
.
 and
and
 are simply padding parameters that indicate how far before the
y-axis that the voltage and current curves respectively, cross the x-axis.
 is the phase angle between the
voltage and the current. It measures the distance between the points where each curve crosses the x-axis. In this graph, the voltage leads the current.
Or we can say that since the current peaks later than the voltage, that the current lags the voltage.
  is derived from the product of the instantaneous values
of
  and
and  .
Now, note this interesting point; even though both current and voltage are oscillating between large positive and negative values, the power is almost entirely positive! Why?
The only time the power will be negative is when the sign of the voltage and current do not match. This only occurs in our example during the time covered by the
phase angle
  where voltage has turned negative and before
the current has crossed the x-axis to become negative. Were voltage and current exactly in phase, the power would
be 100% positive!